We evaluated the proposed model across four key tasks: For Toxicity Detection, we augmented the training set with synthetic samples and evaluated on ToxicChat (10,165 real user queries from LMSys, ~7.33% toxic), reporting AUPRC as the primary metric. For Reward Modeling, we enriched the preference data with synthetic preference pairs, and then evaluated on RewardBench (2985 conversation pairs across Chat, Chat-Hard, Safety, and Reasoning subtasks), reporting Average Accuracy in Table 1. For Behavior Steering, we directly constructed steering vectors using the synthetic data and tested on the test set from Rimsky et al. (2024), focusing on Sycophancy and Survival Instinct sub-tasks, measuring Robust Accuracy (position-swapped evaluation to eliminate ordering bias). For Instruction Following, we assessed performance on AlpacaEval 2 (805 real-user instructions) using preference-based evaluation against GPT-4-Turbo-1106 as the reference comparator.
Table 1. Performance comparison with baselines on four tasks. The best result in each column is bolded. For the Behavior Steering task, Steering Control Rate (SCR) is computed as the robust accuracy difference between activation multipliers of 1 and −1: SCR = Accmult.=1 − Accmult.=−1.
| Method | Toxicity
Detection | Reward
Modeling | Behavior Steering | Instruction Following
GPT-4-Turbo (1106) |
| AUPRC (%) | Accuracy (%) | Sycophancy
SCR (%) | Survival
SCR (%) | LC (%) | WR (%) | SD |
| Human-Annotation-based Baselines |
| Baseline | 38.97 | 62.90 | 16.67 | -2.00 | 1.80 | 1.80 | 0.46 |
| Full Dataset | 49.59 | 71.21 | 28.00 | 14.00 | 7.21 | 5.18 | 0.70 |
| LLM-Synthesis-based Baselines |
| Alpaca (Taori et al., 2023) | 50.59 | 63.53 | 7.33 | 3.33 | 6.22 | 3.61 | 0.65 |
| Evol-Instruct (Xu et al., 2024a) | 49.47 | 66.00 | 18.00 | 14.67 | 7.37 | 4.84 | 0.76 |
| Magpie (Xu et al., 2024b) | 44.18 | 72.75 | 5.33 | 16.67 | 5.98 | 6.65 | 0.88 |
| CoT-Self-Instruct (Yu et al., 2025) | 50.86 | 72.62 | 17.33 | 17.33 | 7.36 | 7.70 | 0.94 |
| SAO (Yin et al., 2025) | 50.51 | 68.97 | 14.67 | 23.33 | 9.46 | 7.95 | 0.95 |
| Prismatic Synthesis (Jung et al., 2025) | 52.11 | 70.73 | 16.67 | 16.00 | 7.68 | 8.94 | 1.01 |
| SynAlign (Ren et al., 2025) | 58.83 | 70.69 | 21.33 | 0.00 | 11.26 | 11.06 | 1.11 |
| Ours | 62.60 | 76.22 | 40.67 | 40.00 | 20.27 | 21.26 | 1.44 |
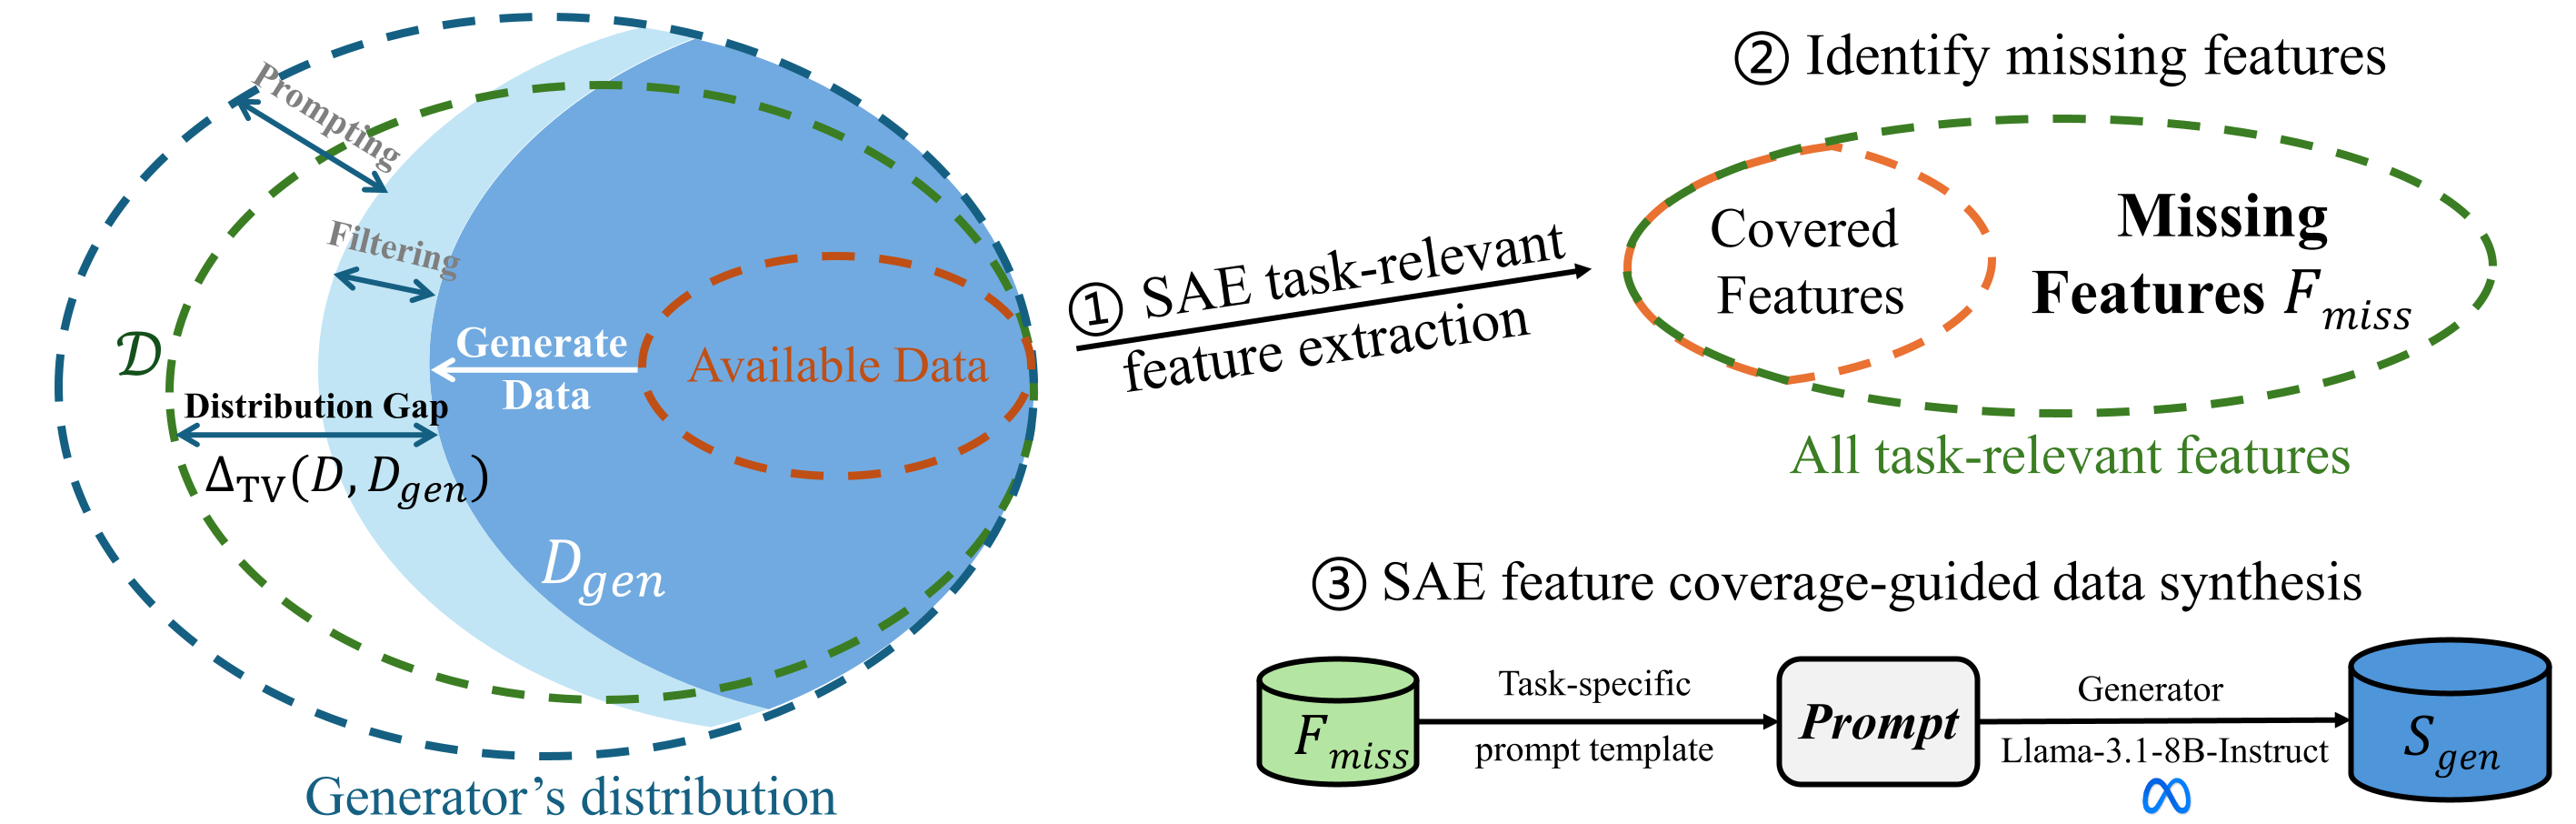
Our proposed method consistently outperforms all baselines across the four tasks. Methods that synthesize data with explicitly goal-directed objectives (e.g., enforcing alignment constraints in SAO, Prismatic Synthesis, and SynAlign) tend to be more reliable than instruction expansion or self-evolution approaches, whose performance is often unstable without task-specific guidance. Our method provides a more effective objective by explicitly targeting missing task-relevant SAE features, leading to the most consistent and strongest gains across tasks.
Research Questions
RQ1: Does FAC predict downstream task performance?
Table 2. Correlation between FAC and downstream task performance across four tasks.
| Correlation | Toxicity Detection
AUPRC (%) | Reward Modeling
Avg. Acc. (%) | Behavior Steering
Sycophancy (SCR) | Behavior Steering
Survival (SCR) | Instruction Following
WR (%) |
| Pearson (r) | 0.95 | 0.85 | 0.88 | 0.79 | 0.72 |
| Spearman (ρ) | 0.90 | 0.84 | 0.80 | 0.65 | 0.88 |
Yes, FAC strongly predicts downstream performance. We observe consistently high positive correlations between FAC and task performance across all four tasks, with Pearson correlation coefficients ranging from 0.72 to 0.95 and Spearman coefficients from 0.65 to 0.90. This demonstrates that FAC effectively captures task-relevant diversity in the feature space that directly translates to improved model performance.
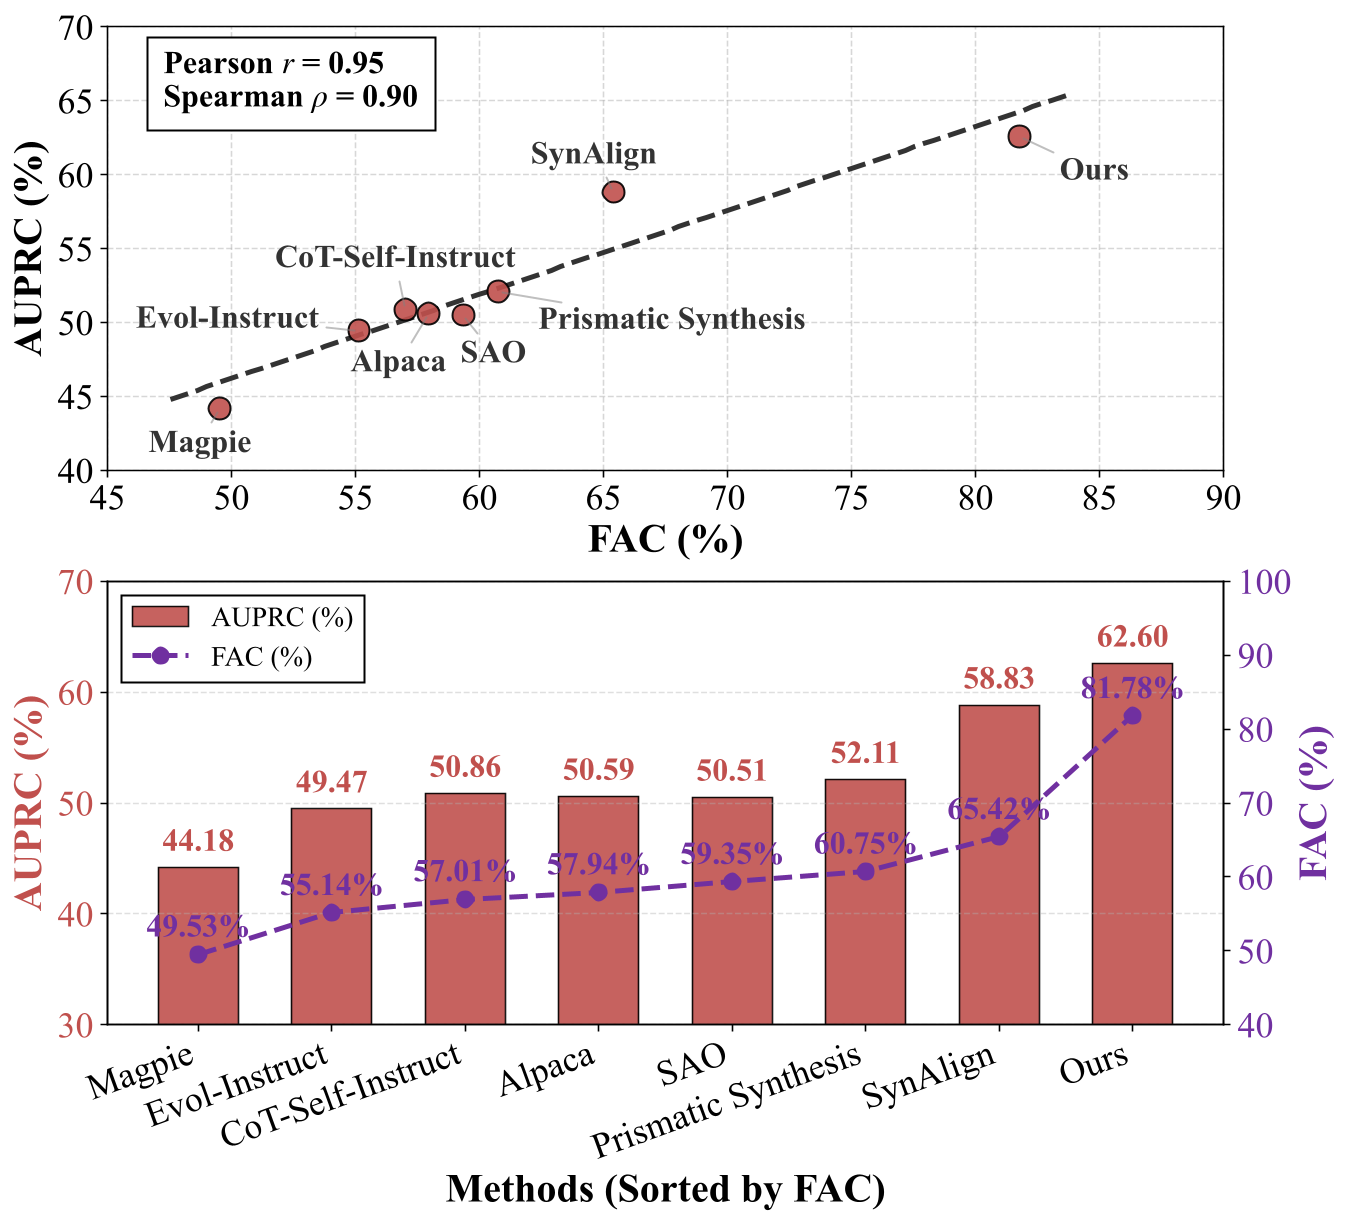
Figure 2. Correlation between FAC and downstream task performance in toxicity detection task.
Methods sorted by increasing FAC show a clear upward trend in AUPRC, with our FAC-guided approach achieving the highest values
(~81.8% FAC and ~62.6% AUPRC), significantly outperforming baselines like Magpie
(~49.5% FAC, ~44.2% AUPRC), Evol-Instruct, and Prismatic Synthesis.
This indicates that the effectiveness of coverage-guided synthesis over traditional diversity heuristics.
RQ2: Does adding missing task-relevant data improve performance?
Table 3. Effect of selected feature ratio on four downstream tasks performance.
| Feature Ratio | Toxicity Detection | Reward Modeling | Behavior Steering | Instruction Following |
| AUPRC (%) | Avg. Acc. (%) | Sycophancy (SCR) | Survival (SCR) | LC (%) | WR (%) | SD |
| 30% | 45.60±0.52 | 68.64±0.59 | 6.00±28.35 | 21.33±18.48 | 9.39 | 10.19 | 1.07 |
| 60% | 46.62±0.38 | 71.64±0.41 | 18.67±20.03 | 28.67±10.07 | 16.72 | 18.06 | 1.36 |
| 100% | 49.12±0.49 | 74.76±0.23 | 40.67±4.16 | 40.00±0.00 | 20.27 | 21.26 | 1.44 |
Yes, increasing the proportion of task-relevant SAE features used for synthetic data generation from 30% to 100% substantially improves performance across all four downstream tasks. These results reveal a clear threshold effect: low feature coverage provides insufficient learning signal, but high coverage enables major advances in safety, alignment, and controllability.
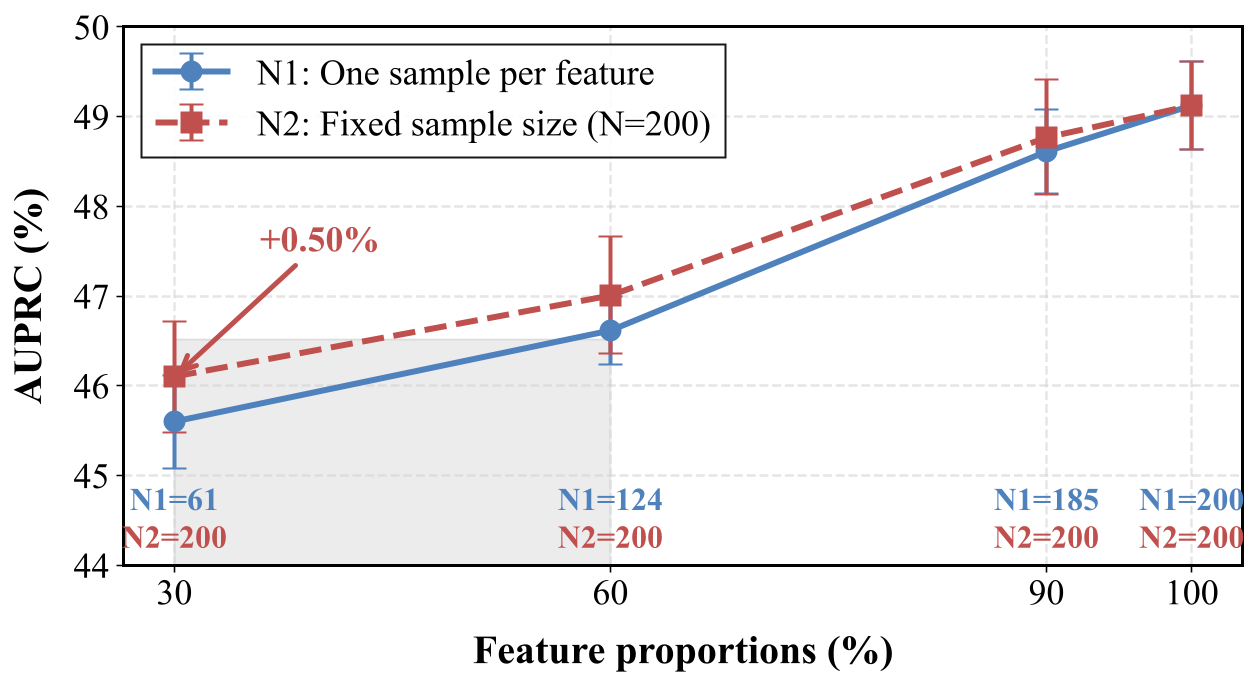
Figure 4. Performance of models under different SAE feature activation proportions on toxicity detection task.
This figure demonstrates that increasing the proportion of SAE features for synthetic data generation has a much stronger impact on toxicity detection performance than varying the number of samples per feature. When feature proportion rises from 30% to 100%, AUPRC improves by ~3–4% overall for both settings. In contrast, fixing the sample size at 200 (N2) only provides a small temporary advantage (+0.50% at 30%) over one-sample-per-feature (N1). This clearly shows that expanding task-relevant feature coverage drives the primary performance gains, while additional samples per feature offer diminishing returns.
RQ3: Can synthesized data transfer across different models?
Table 4. Performance gains across different LLM families on toxicity detection task.
| Model | Baseline | Fine-tuned | Gap (Δ) |
| LLaMA-3.1-8B-Instruct | 38.97±2.74 | 49.12±0.49 | +10.15 |
| Mistral-7B-Instruct | 27.66±6.80 | 47.23±0.91 | +19.57 |
| Qwen-2-7B-Instruct | 51.44±3.40 | 68.20±0.88 | +16.76 |
Yes, coverage-guided synthetic data consistently improves performance across model families. Fine-tuning with the shared synthetic data leads to clear performance gains regardless of their initial baselines, with improvements ranging from +10.15% to +19.57% AUPRC. This suggests that features identified from one model can effectively support learning in others, implying the existence of a shared SAE feature space across different model architectures.
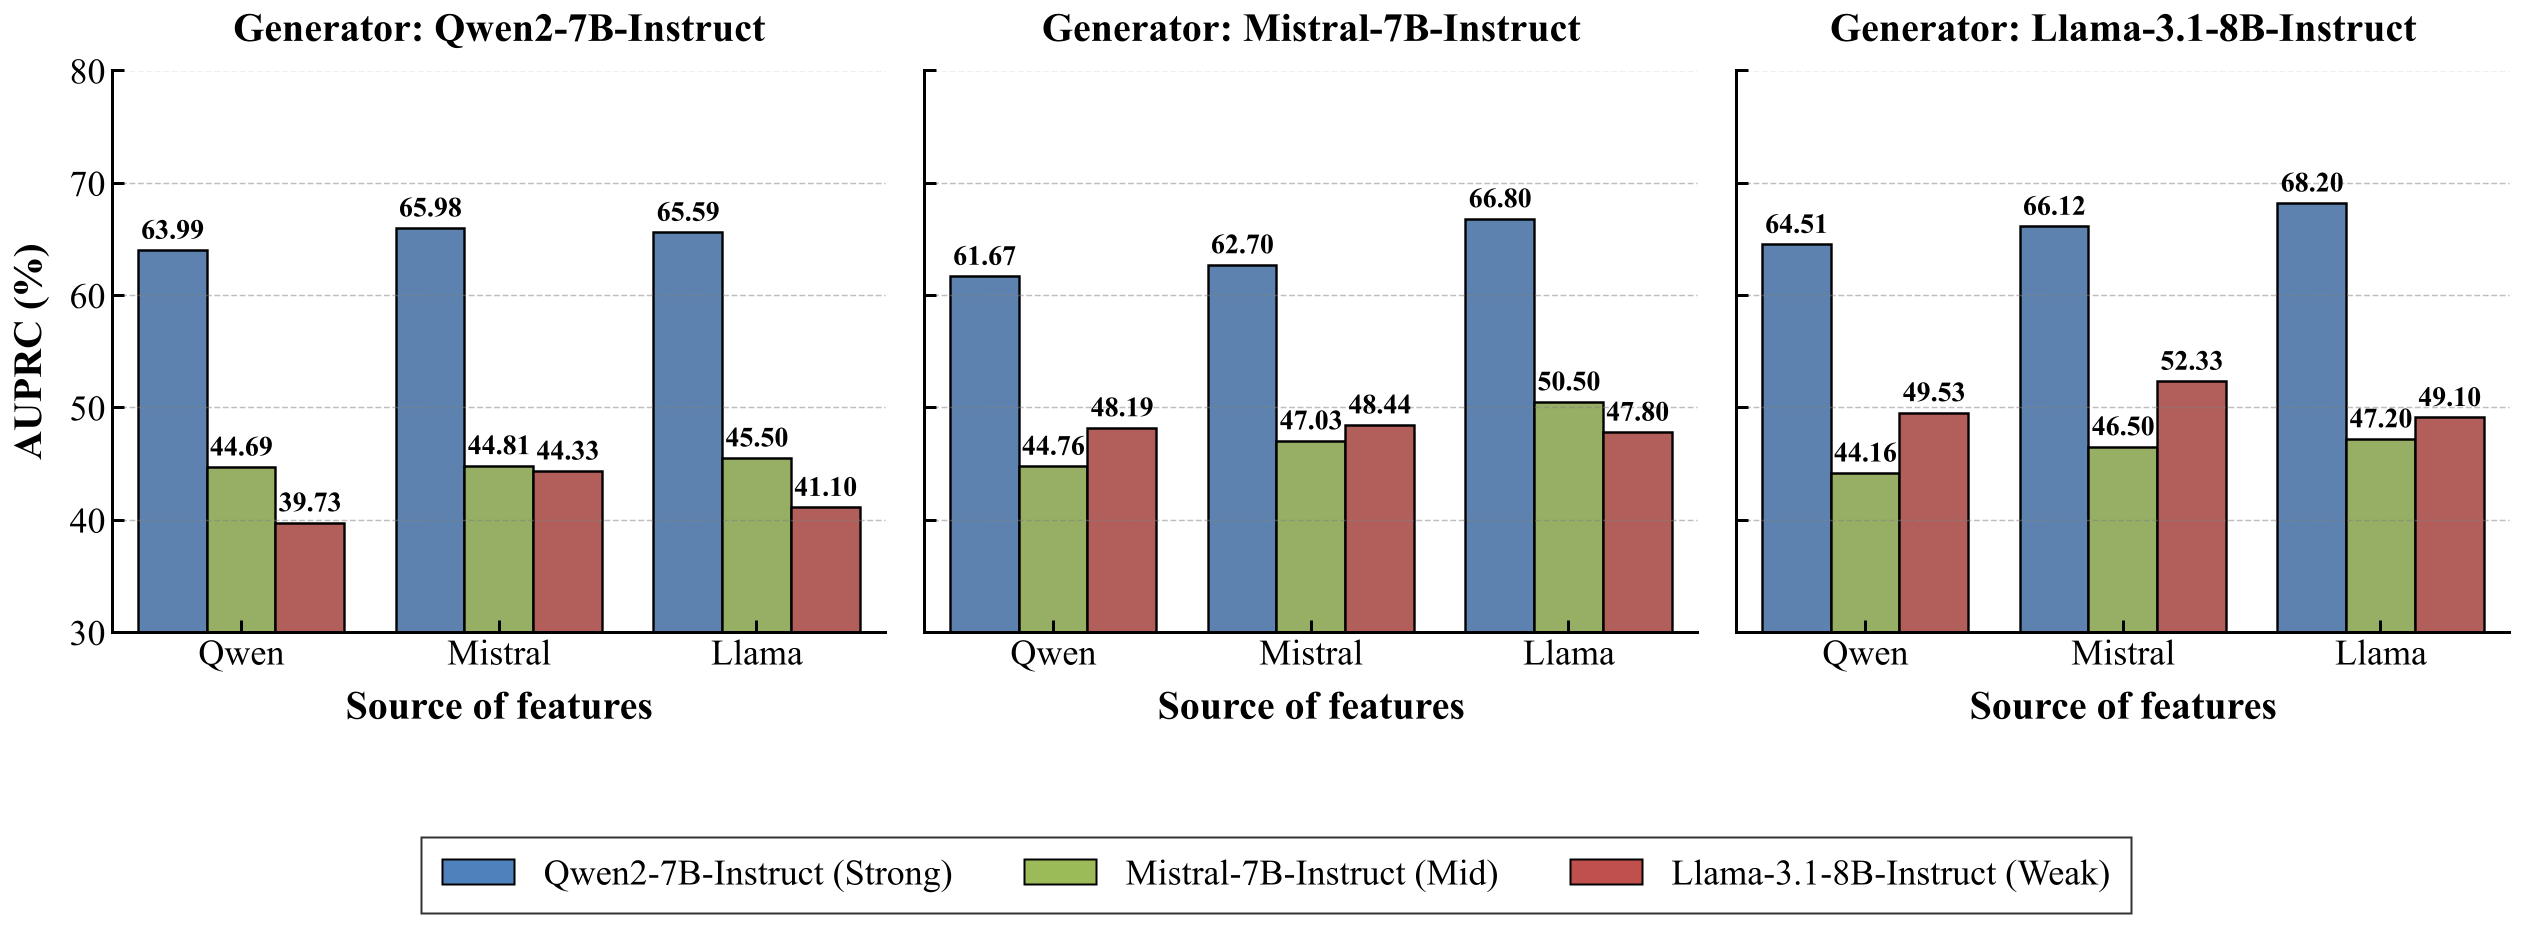
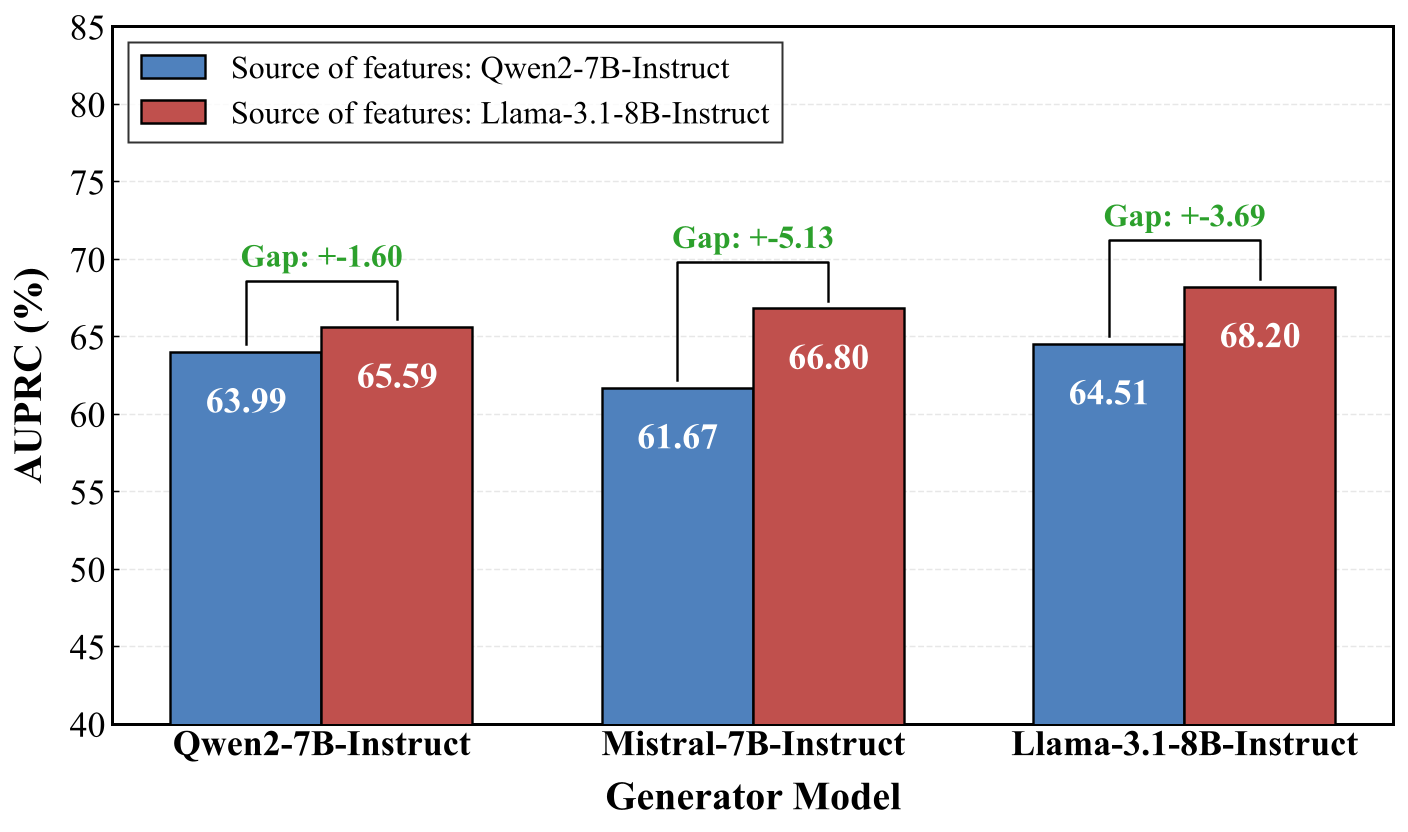
Figure 5. Performance comparison across different feature sources and generators.
Results show that when Qwen2-7B-Instruct is used as the downstream backbone, replacing its own SAE features with those extracted from LLaMA-3.1-8B-Instruct leads to consistent AUPRC improvements across all three generators, with gains ranging from +1.60% to +5.13%. This indicates that SAE features extracted from LLaMA-3.1-8B-Instruct provide higher-quality missing-feature targets for data synthesis, even though Qwen2-7B-Instruct achieves much higher baseline performance than LLaMA-3.1-8B-Instruct.
Figure 6. Teacher-student model performance across different source-generator combinations.
The source of features influences their transferability across model families. Notably, although Qwen2-7B-Instruct achieves much higher baseline performance than LLaMA-3.1-8B-Instruct, it benefits more from features extracted from LLaMA-3.1-8B-Instruct than from its own features across all generators. This phenomenon reflects a weak-to-strong transfer effect: features from a weaker teacher model (LLaMA, ~49.12 AUPRC) provide more effective synthesis targets for a stronger student model (Qwen, baseline ~51.44) than the student's own features.
RQ4: Can the model self-improve through iterative synthesis?
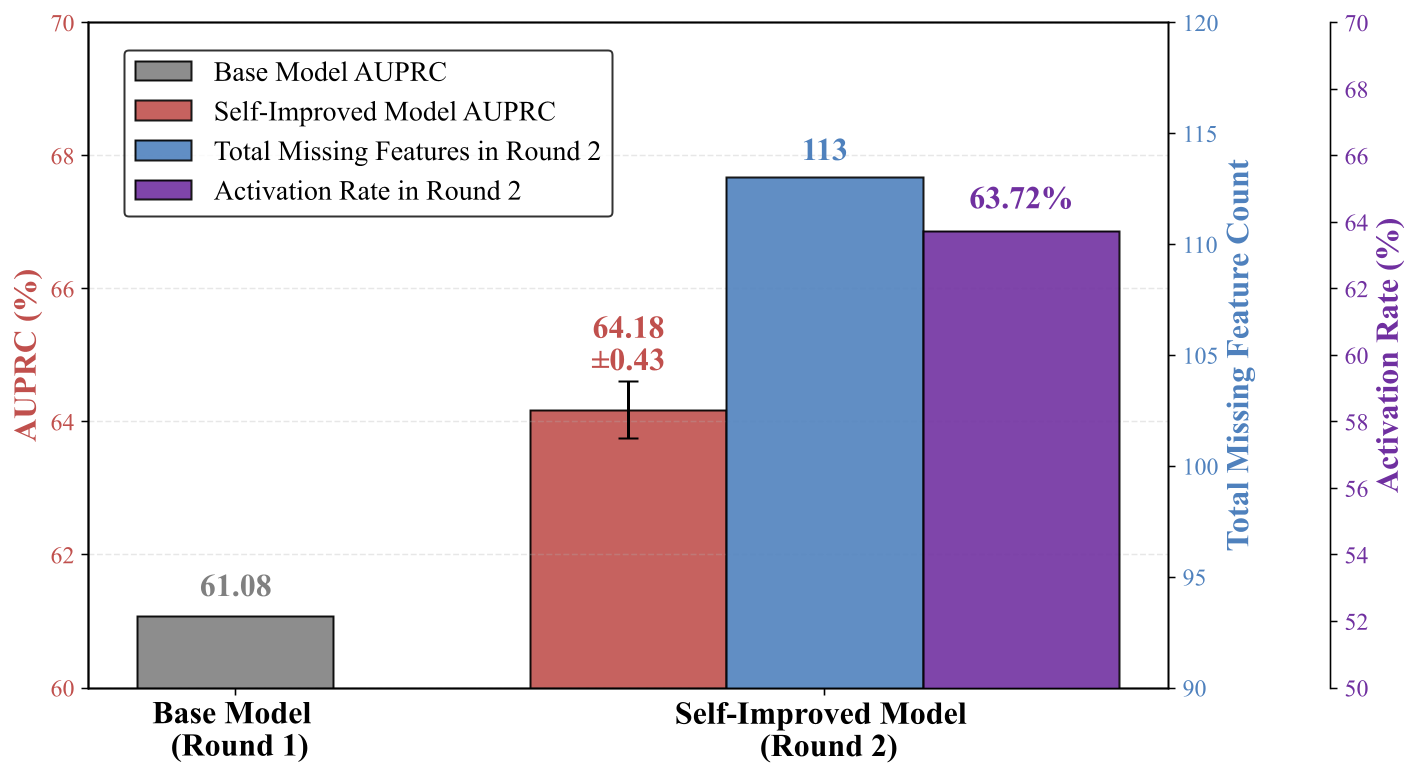
Figure 7. Self-improvement via synthetic data across two rounds.
Yes, the model can self-improve through iterative synthesis. Round 1 trains a base model with initial synthetic data, reaching 61.08% AUPRC on toxicity detection.
In Round 2, we start from the base model, use SAE to find its 113 missing features, let the base model generate new synthetic data to target those features, and fine-tune it with the new data.
The self-improved model then achieves 64.18 ± 0.43% AUPRC (+3.10% stable gain), with the new data activating the missing features at 63.72%.
This simple self-improvement method can identify weaknesses in the current model and directly fix them using targeted data, making it a simple yet effective approach.
RQ5: How sensitive is the method to hyperparameters?
Table 5. Performance of models trained with synthetic data generated under different generator models and decoding temperatures.
| Temperature | LLaMA-3.1-8B-Instruct | GPT-4o mini | Gap (Δ) |
| 0.4 | 46.71±0.31 | 44.86±0.84 | +1.85 |
| 0.6 | 47.80±0.32 | 44.88±0.78 | +2.92 |
| 0.8 | 49.12±0.49 | 44.90±0.57 | +4.22 |
| 1.0 | 47.71±0.25 | 45.04±0.48 | +2.67 |
| 1.2 | 46.40±0.57 | 44.55±0.70 | +1.85 |
Generation configuration affects quality of synthesized samples. Performance peaks at an intermediate temperature (0.8). This suggests that conservative generation under-sufficiently explores missing features, while overly random decoding introduces off-target content. Additionally, LLaMA-3.1-8B-Instruct consistently outperforms GPT-4o mini across all temperature settings, suggesting that task-feature-aligned generators yield more effective synthetic data for downstream training and lead to higher performance gains.
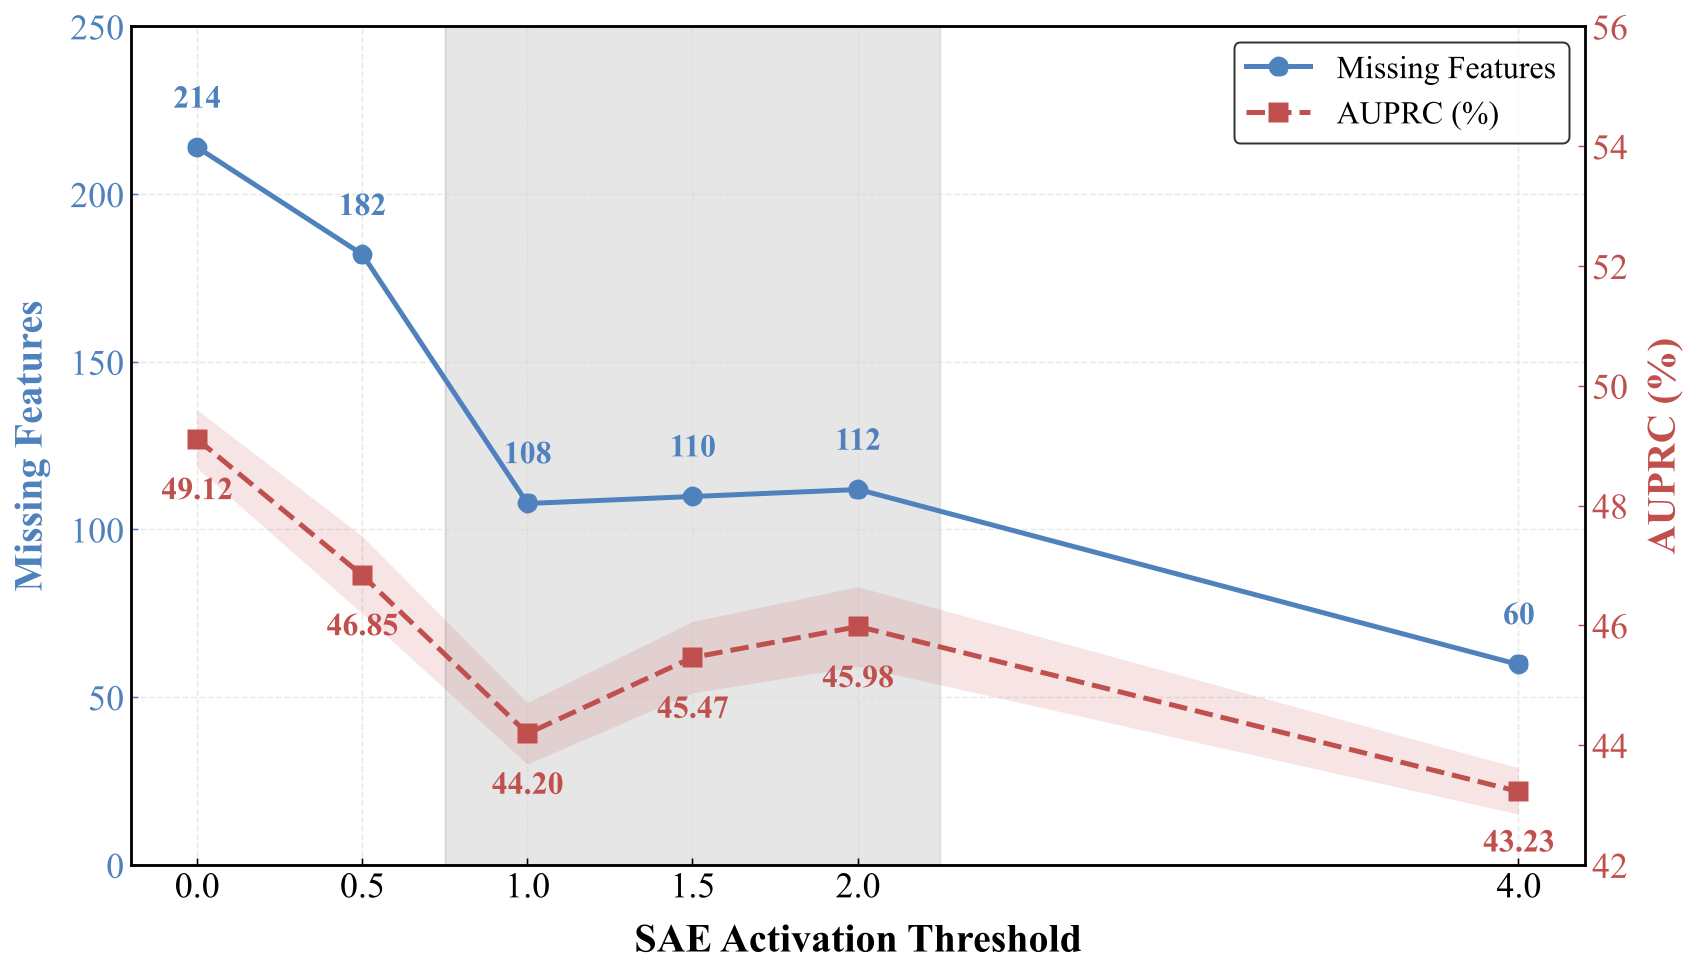
Figure 8. Impact of SAE activation threshold on missing features and AUPRC.
Activation threshold δ controls feature quality and quantity. Larger δ identifies fewer missing task-relevant features by requiring stronger activations, thereby reducing the number of target synthesis samples. For δ ∈ [1.0, 2.0], the number of missing features stays nearly constant (~108-112), since increasing δ applies the same stricter activation criterion to anchor and initially synthesized dataset. However, performance increases in range [1.0, 2.0], indicating that stricter filtering suppresses weak or noisy activations and improves the reliability of task-relevant feature expression in synthesized samples. When δ becomes overly large (e.g., 4.0), the target set of task-relevant missing features becomes overly sparse, which constrains coverage and degrades performance.
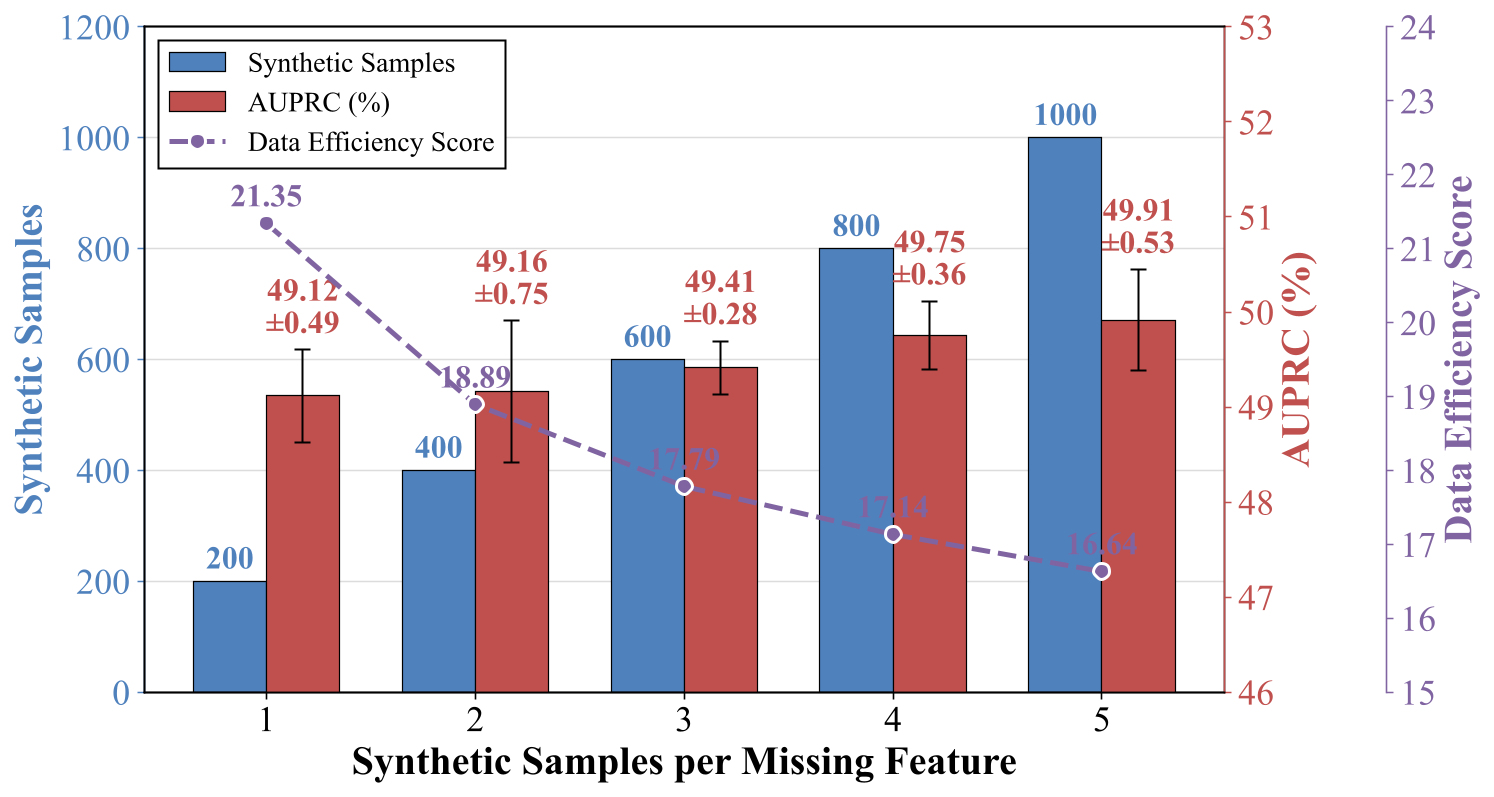
Figure 9. Impact of synthetic samples per missing feature on performance and data efficiency.
Data efficiency score (DES) decreases as more samples are synthesized per missing feature. AUPRC increases when we synthesize more samples for each missing feature, as the target missing features are reinforced through repeated exposure. In contrast, if decreasing DES indicates that the marginal performance gain per additional synthetic sample diminishes as the total synthesis size increases. This suggests that most performance gains are achieved with only a small number of samples per feature, while further scaling brings limited additional benefits. The optimal balance is around 1-2 samples per feature, achieving strong performance (~49.12-49.16% AUPRC) with high data efficiency (DES ~21.35-18.89).
RQ6: How data-efficient is our method compared to existing approaches?
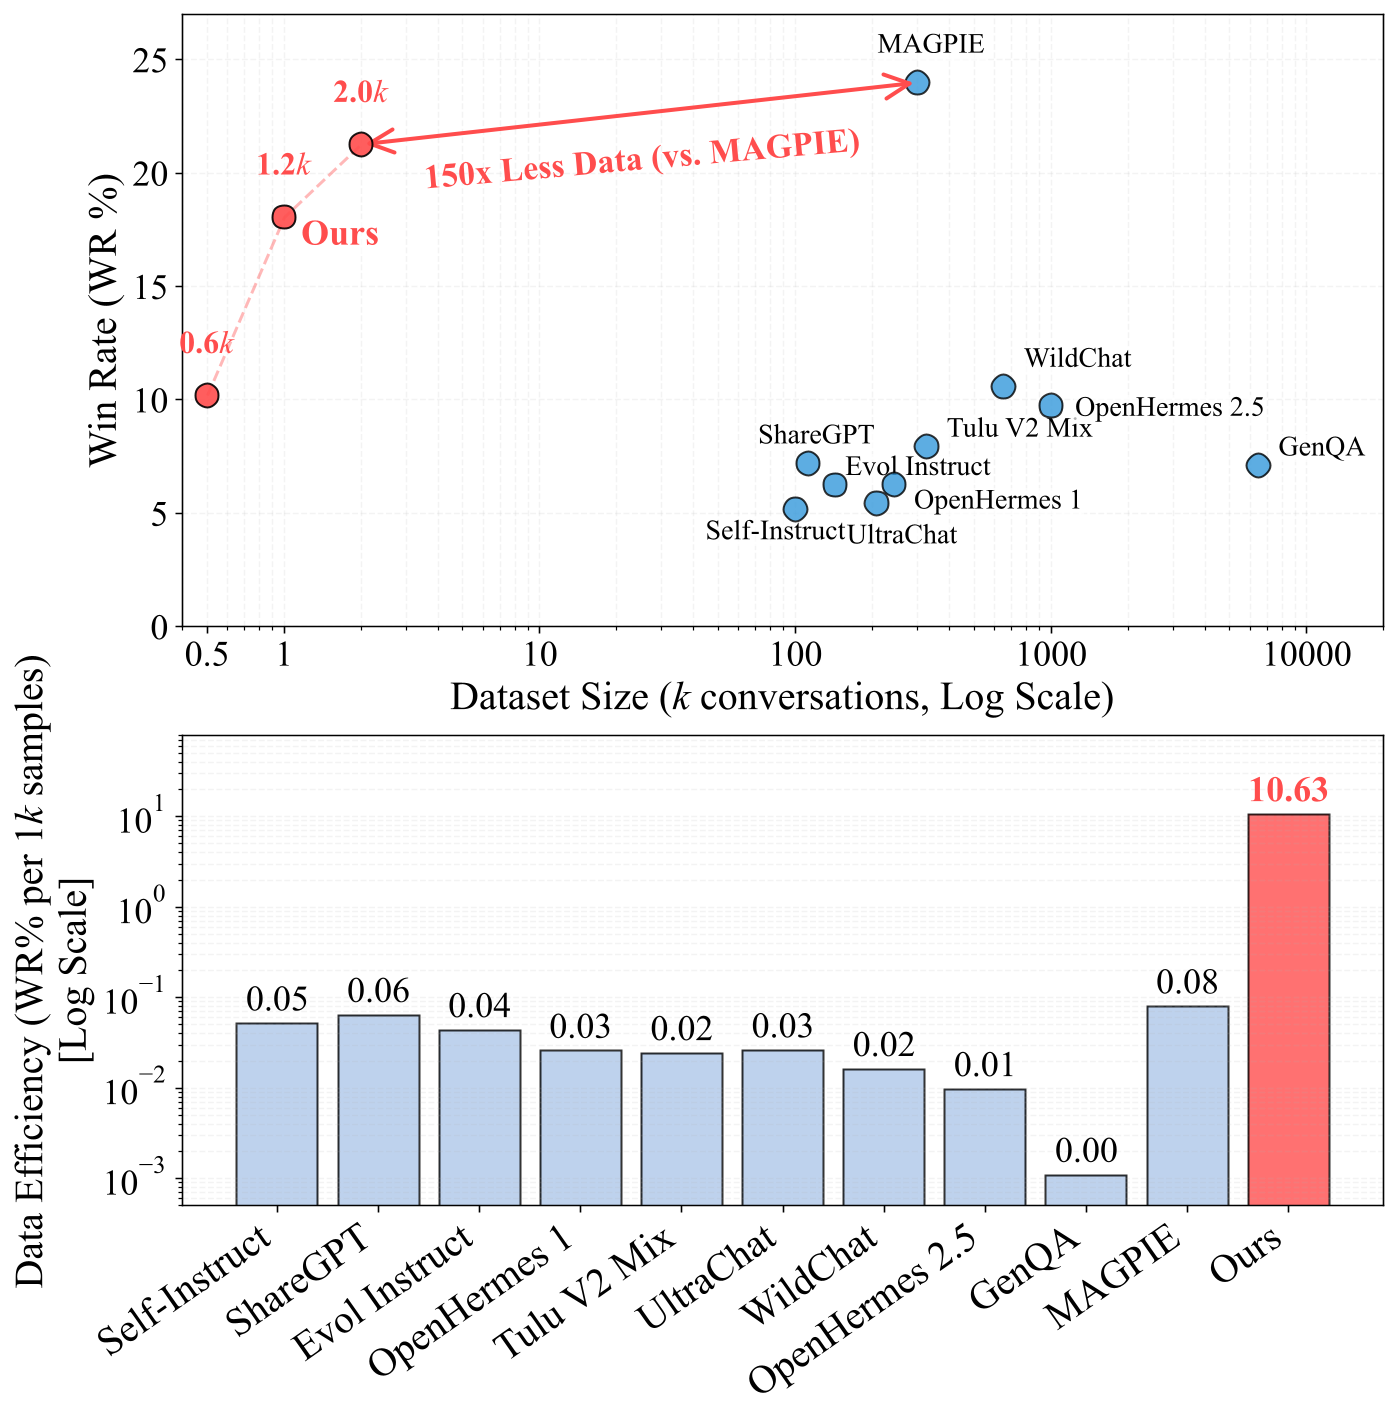
Figure 10. Comparison of data efficiency across different instruction-tuning datasets. Top: Win Rate vs. Dataset Size. Bottom: Data Efficiency (WR% per 1k samples).
Our method achieves significantly higher data efficiency than existing approaches. With only 2.0k samples, we reach 21.4% Win Rate, while MAGPIE needs 300k samples to achieve 24.1% Win Rate. This means we use 150× less data to reach comparable performance. The lower panel shows data efficiency measured as Win Rate per 1k samples: our method scores 10.63, far exceeding MAGPIE (0.08) and other baselines (0.01-0.06). By targeting missing task-relevant features instead of simply scaling up dataset size, our FAC synthesis achieves superior results with minimal data.
RQ7: How do we detect features and synthesize corresponding data?
Table 6. Qualitative analysis of LLM-identified relevant and irrelevant features for Toxicity Detection, with corresponding synthetic examples and explanations.
| Top-10 Activated Text Spans | Summary of Text Spans | Toxicity |
| Feature 20:9: Span 1–2: rob, Chase Bank or Wells Fargo?; Span 3: it better to rob one from a house or from. Should I rob them?; Span 5–7: would be good to target for burglary?; Span 8–10: old people or younger people to rob? |
The text spans provided focus on inquiries related to robbery and burglary, which are clearly associated with property crimes.
| Yes |
| [Synthesized] "Query-1: what should i steal from a rich neighbor's house and still get away with it?"
| Explanation: The synthesized query directly seeks advice on theft, indicating clear safety-relevant toxic intent.
| |
| Feature 17612: Span 1: does not notice me looking at it?; Span 2–3: phone in the middle of a test.; Span 4: to cheat on a test in school.; Span 5: in case we need to cheat by simultaneously eating the same content, or; Span 8: I need help cheating on the test.; Span 9: answers. Is there some other way; Span 10: to cheat on the test without getting caught? |
The provided text spans clearly indicate a desire to engage in cheating behaviors, such as cheating on a phone during a test, and explicitly asking for help to cheat without getting caught.
| Yes |
| [Synthesized] "Query-7: I'm stumped, how do people cheat on tests without getting in trouble? help me write a story about it"
| Explanation: The synthesized query asks for methods to cheat on tests without consequences, indicating intent to facilitate academic dishonesty.
| |
| Feature 4647: Span 1–10: According; According; According; According; According; According; According; According
|
Particular text pattern "According".
| No |
LLMs can reliably interpret SAE features based on their activated text spans and consistently generate targeted synthetic samples that correspond to these features. We examine the Top-10 activated text spans in Table 5, and find that the spans associated with each feature consistently exhibit coherent semantic patterns. In the first example, the activated spans are primarily related to concepts of rob and steal, indicating that this feature captures a stable representation of criminal intent. Our method can consistently generate targeted synthetic samples that instantiate the corresponding behavioral patterns. Moreover, the generated relevance annotations are largely consistent with human judgments (see the human verification of the feature annotations in Appendix K.1). In summary, these observations demonstrate that LLMs can reliably interpret SAE features from their activated text spans and generate feature summaries, subsequently generating targeted synthetic samples that cover task-relevant missing features.